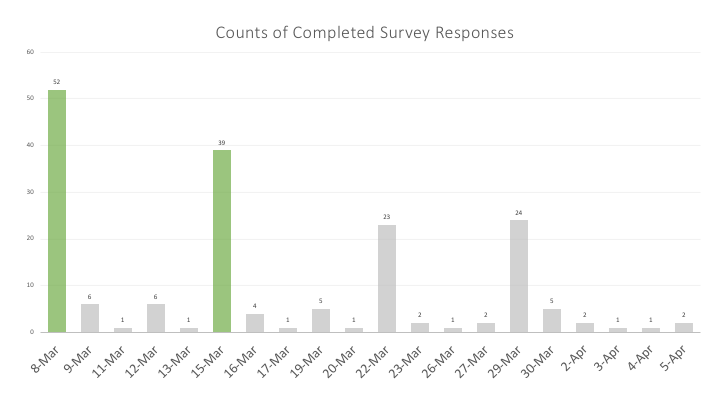
Before I joined the company, survey responding rate is around 5%. After optimizing survey design and distribution, I increased the rate to 15%. We are collecting more data with the same budget.
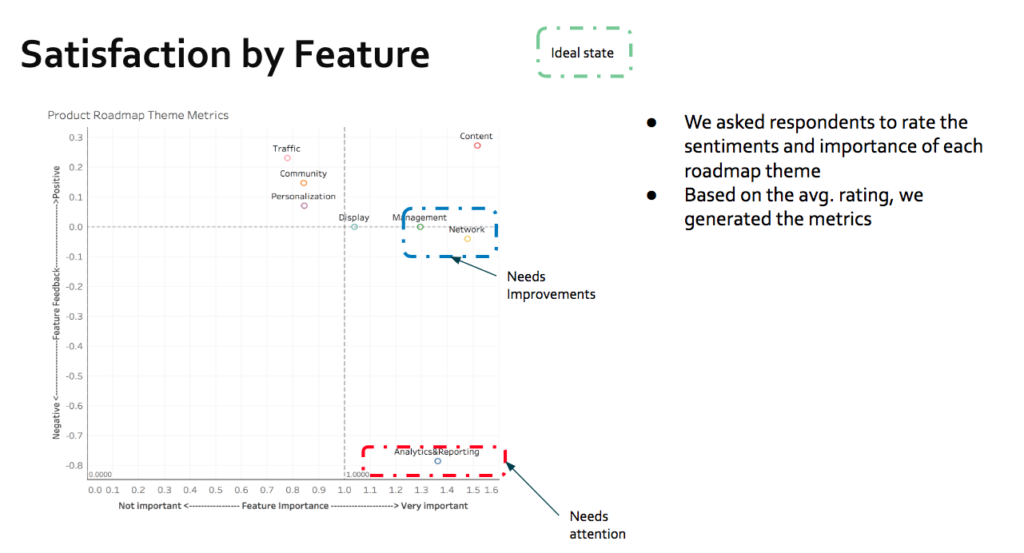
At Bazaarvoice, I am the “Survey Champion” on the product team. I am an expert-level user of Qualtrics and Excel, which I used most frequently for survey research (sometimes I use R and Tableau as a supplement). In 2018, I accomplished 6 surveys projects, sent out to both internal and external respondents. I analyzed datasets which contain over 3K responses. I invented tools to help the Product team track survey and share learnings. Moreover, based on survey analytics, I created metrics and visualizations to help the Product team plan their roadmaps and priorities.
Survey research is a combination of art and science.
Process
1. Define problem and scope
Survey method is used to answer specific questions. As a result, it is of huge importance to refine vague questions. I usually set up several meetings with key stakeholders to understand the following requirements:
- What question(s) do we want to answer?
- Have we broken down the question to measurable metrics?
- What approaches do we want to use to analyze the survey (e.g. conjoint analysis to compare product features)? This determines what data points to collect.
- Who will answer the survey? Can we distribute the survey to the desirable respondents?
- Are we prepared to take quick actions according to the survey results? If no action can be taken (e.g. budget constraints, technical constraints), there is no urgent need to send survey.
2. Design survey in Qualtrics
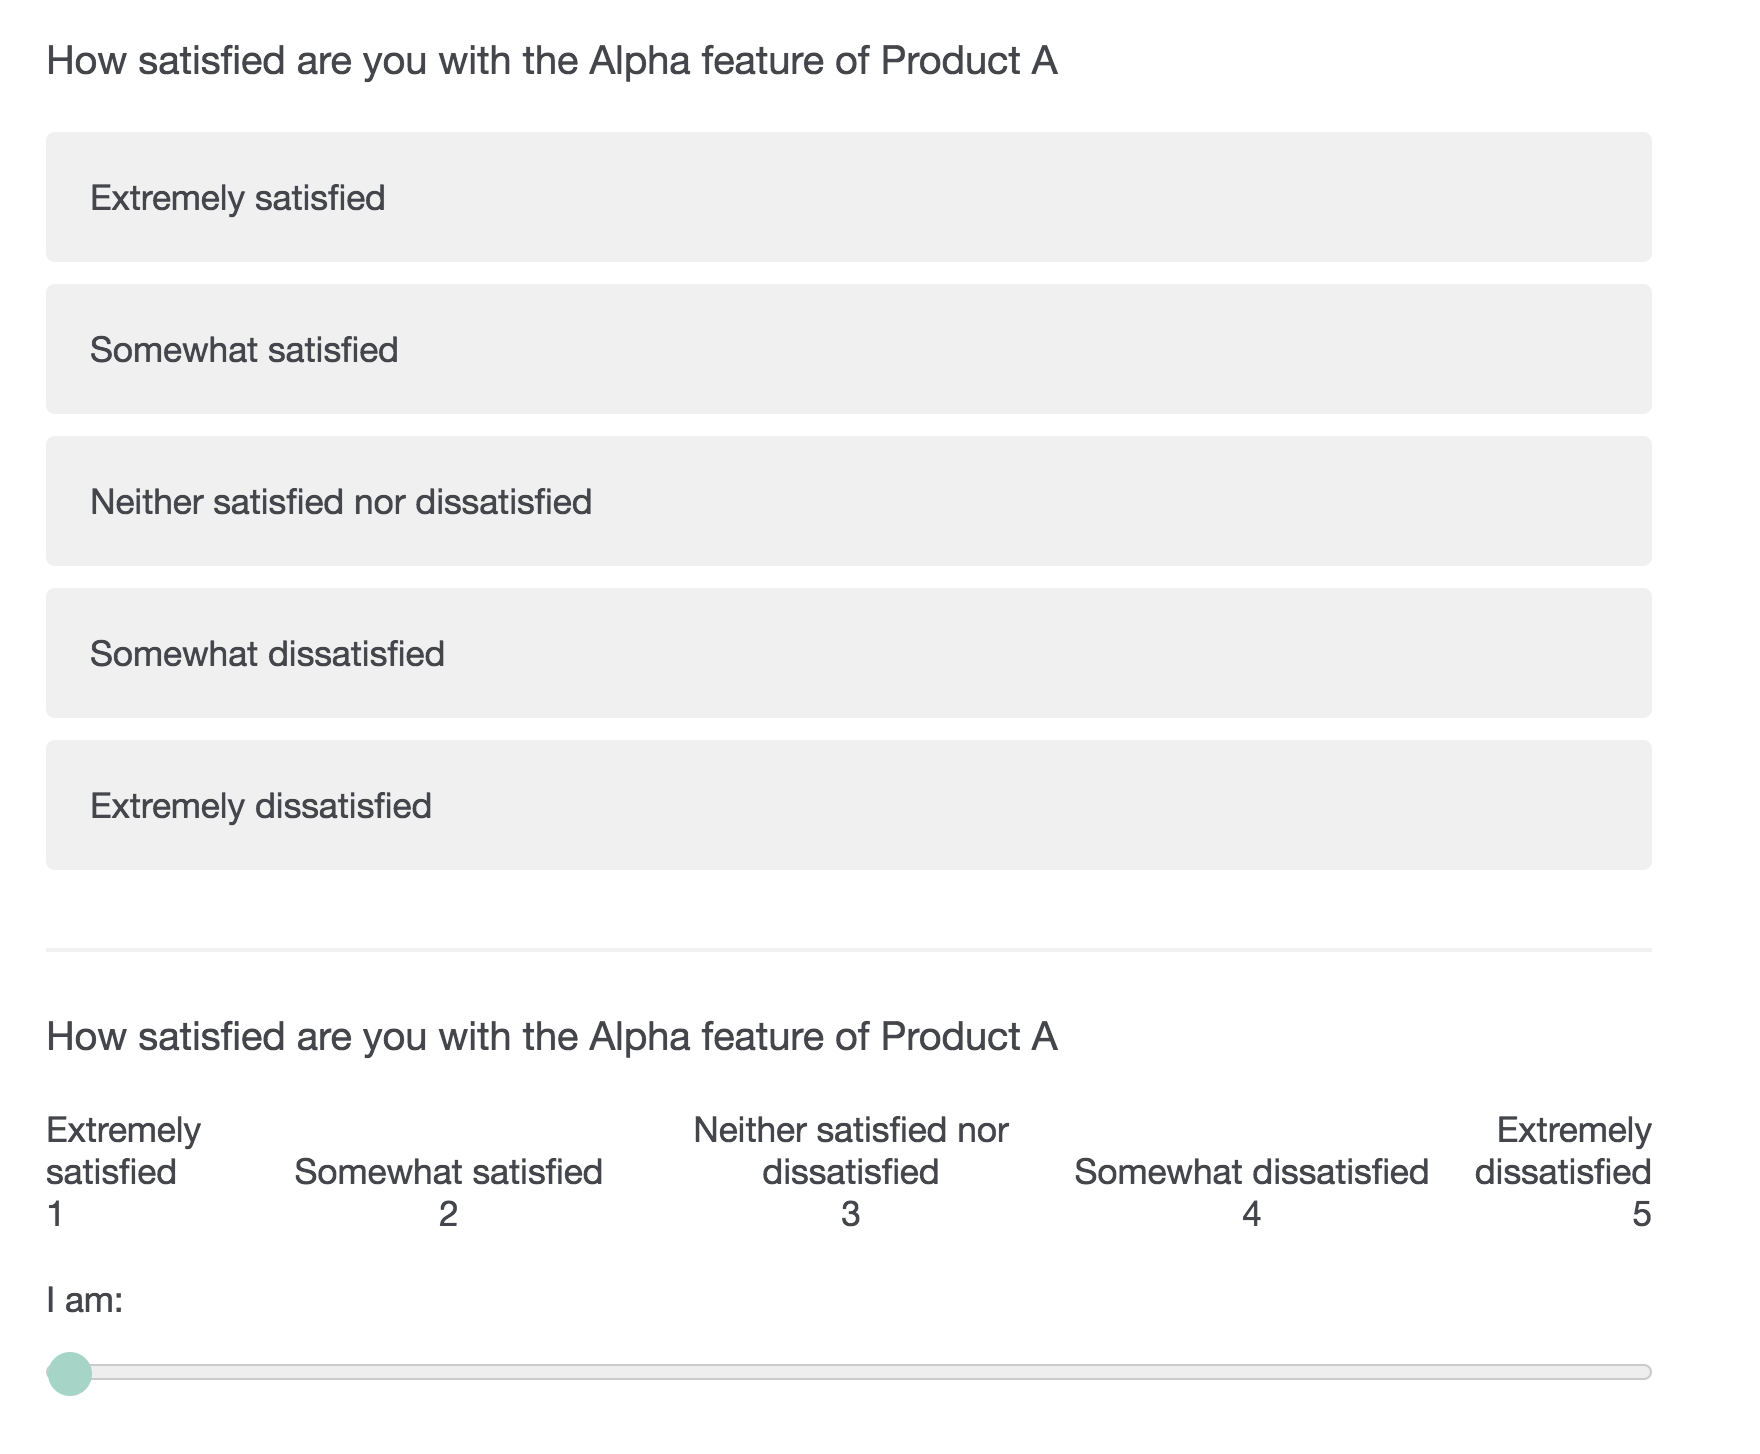
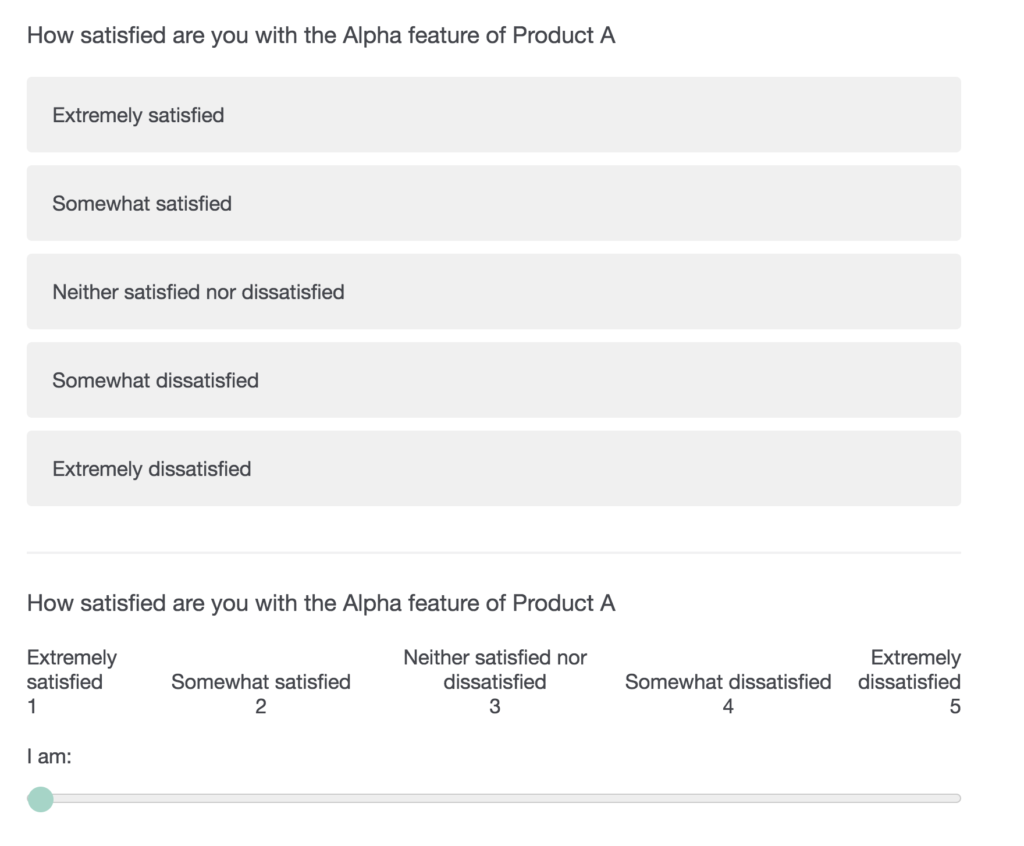
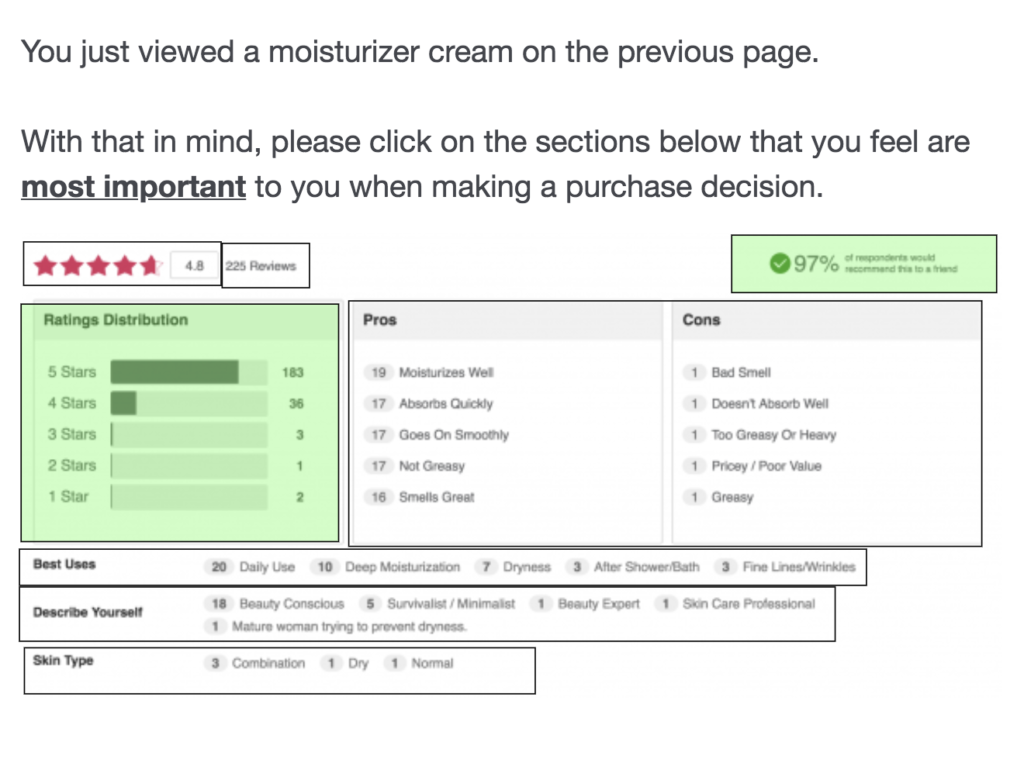
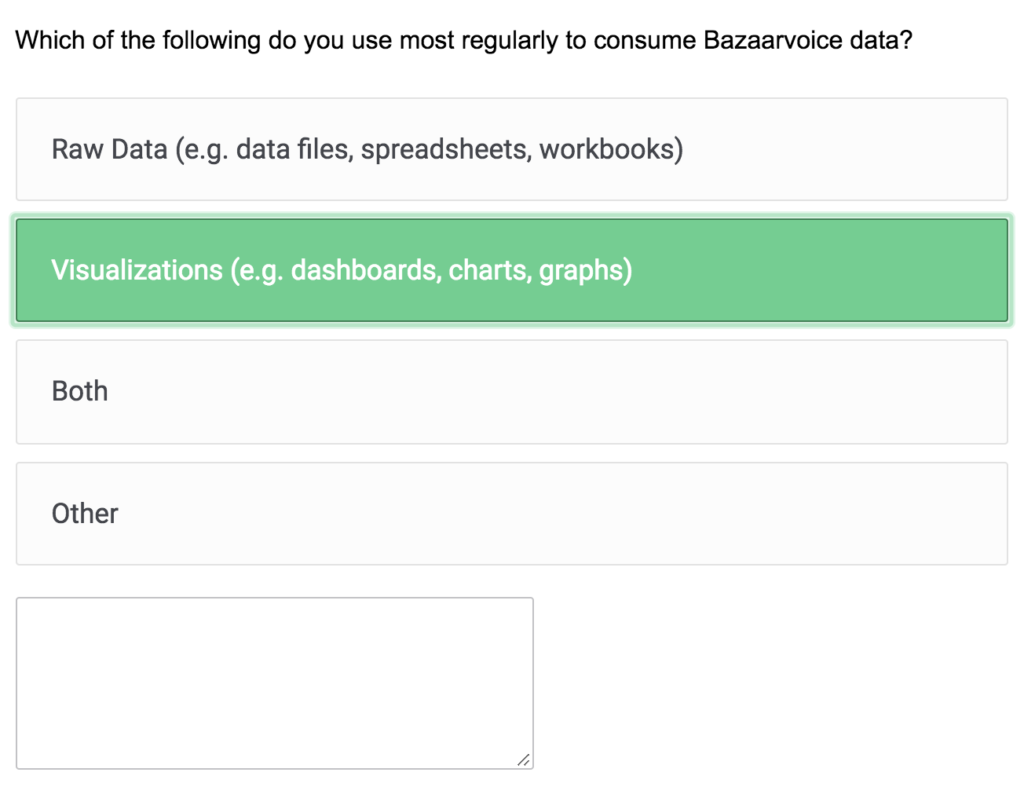
After basic survey questions were agreed upon, I created the survey in Qualtrics. I chose the most appropriate question type to best represent research goals as well as minimize potential confusions among respondents.
3. Distribute survey
The way survey is distributed greatly influenced the responding rate. There are many factors that affect survey distribution, some are controllable some not. According to my experience, there are three often neglected areas that we can address to ensure the distribution quality:
- Email Contents: First, the solicitation email should be concise and clear, addressing the purpose and process of the survey. Second, Qualtrics is able to add a few personalized touches to the email (e.g. automatic first/last name). Personalization helped increase responding rate.
- Notification Email: Client relationship is extremely important so I usually send only one notification email to remind recipients of completing the survey. I usually included some early findings in the email. The purpose of doing so is to let respondents feel that submitting a survey is not only “doing a favor” “but also benefits themselves by getting some insights out of it (add example).
Timing : Which day and at what time to schedule the email greatly influenced responding rate. I usually avoid sending emails in the afternoon or before/afterholiday .
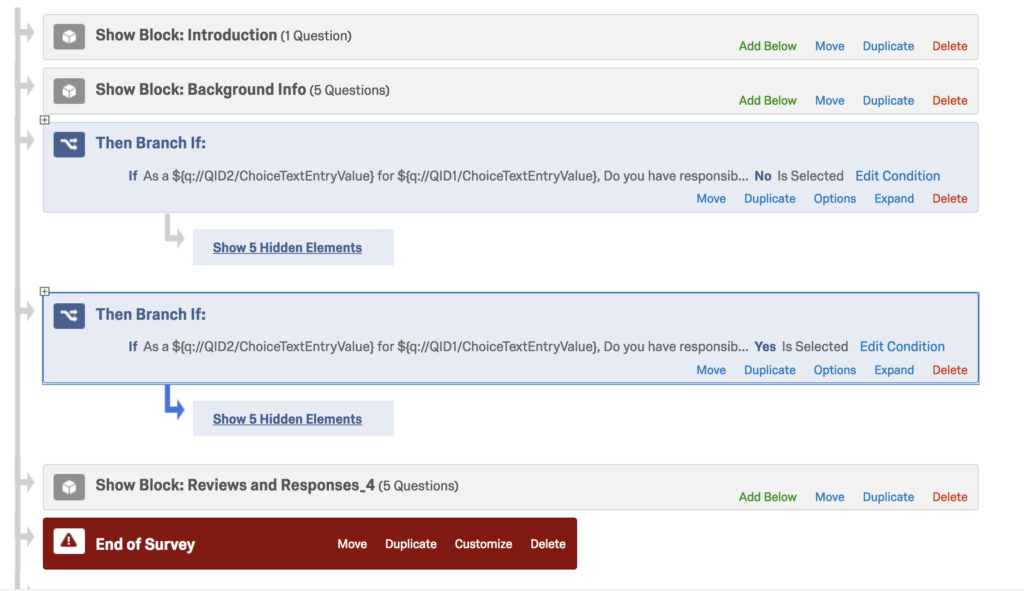
Before I joined the company, survey responding rate is around 5%. After controlling survey flow and distribution, I increased the rate to 15%. We are collecting more data with the same budget.
4.Analyze survey data: Visualization and Interpretation
I exported Qualtrics data into analytics software such as Excel, Tableau and R. I conducted a variety of analysis including EDA (Explorative Data Analysis) and Cross-tab.
I also analyzed the qualitative data. I applied a research technique called “coding” to quantify and organize qualitative responses.
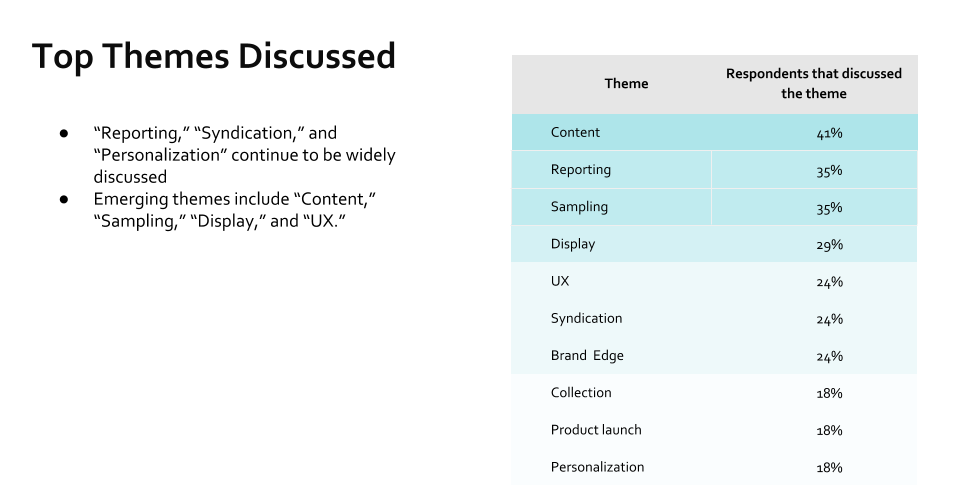
Actionable Insights
Survey research results helped the Product team:
- Discover user needs
- Monitor product performance
- Prioritize items on the roadmap
- Testing product concept
